While it is no longer necessary to remind people of the impacts of air quality on our health and economy, I wanted to share the result of a personal experience conducted during this festive season, which is conducive to recipes that warmly combine cheese and charcuterie. We often talk, and rightly so, about the problems associated with fine particles in our streets and in the metro, but we all too rarely think to question what happens under our own roof
Raclette VS MEtro ➝ methodologie
“For the measurement of indoor/outdoor, stationary and mobile air quality, I use several sensors (which I will present soon) that allow for the collection of data at a high frequency, up to every second. Timestamped, geolocated, and contextualized, it is then possible to perform exposure analyses over time, in space, and by activity.
>>> This is, in fact, our specialty at AirSentinels.
For the measurement in the metro, a specific sensor was used due to the different properties of fine particles in this type of environment.
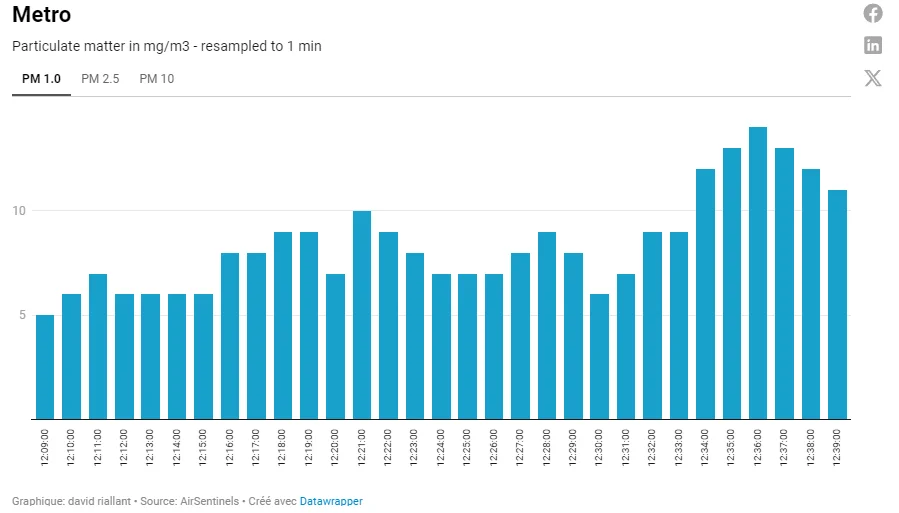
Metro measurements: travel time 30 minutes, 1 measurement every 10 seconds, journey from Gare de Lyon to Jacques Bonsergent (Line 5) with a change at Bastille.
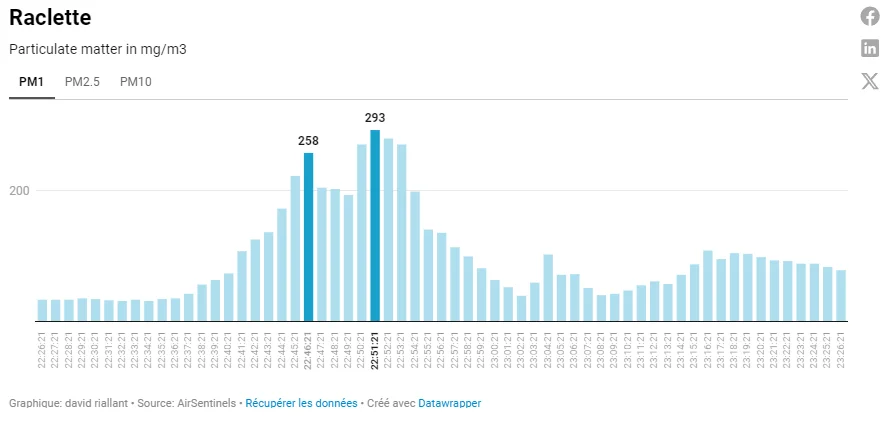
Raclette: measurement duration 60 minutes, 1 measurement every 1 minute, cheese, coppa, ham… a typical raclette… Room of 30 m² with an average ceiling height of 3m.”
Raclette VS Metro ➝ results
“Without further suspense, the raclette emerges as the clear winner, by far. With an average PM 10 level about 10 times higher than that measured in the metro (similar orders of magnitude for PM 2.5 and PM 1), with peak values being up to 20 times higher.
| PM 1 | PM 2.5 | PM 10 | |
|---|---|---|---|
| Metro | |||
| Min. | 4 | 5 | 8 |
| Max. | 14 | 22 | 40 |
| Avg. | 8 | 12 | 22 |
| Raclette | |||
| Min. | 32 | 35 | 51 |
| Max. | 293 | 396 | 773 |
| Avg. | 101 | 127 | 234 |
And yet, we aired out the room twice to limit the damage and see the impact of ventilation on improving air quality. In more detail, below is the dynamic evolution over time of the PM rate


Conclusions
So now we can’t eat raclette anymore? Well no, raclette is good, enjoy it. However, as this experiment proves, our activities, especially those related to cooking, have a colossal impact on the daily dose of pollution we breathe. This is especially true in this season when we tend to limit ventilation to keep the warmth, which often turns out to be a real false good idea. With cooking, the air’s humidity level increases, and humid air is harder to heat. So, by airing out, we get rid of particles and humidity, and it only takes a few minutes to return to healthier air.
A few minutes of ventilation can quickly reduce particle levels.
As for the metro and underground railway enclosures, there are obviously improvements to be made, but let’s start by individually adopting the right reflexes.
In a previous study measuring exposure to fine particles, I was responsible for nearly 90% of the volume of particles breathed in a day, with cooking activities again at the top of the list.
In conclusion, we are actors of the air we breathe, and simple adaptations of our behaviors can make a difference.
want to try FOR YOURSELF? Here are some tips
This type of empirical field approach obviously has its limits and can yield different results depending on your cooking methods, for example. For the metro and underground transport in general, I have had higher values in previous measurement sessions. There can also be very strong variations and disparities depending on the lines, stations, and crowd levels.
It’s useful to remember that the number of particles is important (generally expressed in micrograms per cubic meter: µg/m3), but beyond this quantitative approach, it is essential to consider their nature (the source), which plays a significant role in their impact on our bodies.
It’s also important to understand that a sensor measures one or several specific pollutants. Your sensor might be green, but your air could still be polluted with another pollutant. Sensors also have detection limits, meaning they won’t ‘see’ what’s happening outside these limits (for example, very small or larger particles).
Finally, consider how you handle the sensor: avoid friction (for example, in the metro) that can disturb the measurements, and if you want to take measurements on the move, consider the impact of speed on the measurement. Typically, putting a sensor on a bike without further precautions may result in a direct correlation between speed and PM rate due to disturbances on the fluidics – the flow of air inside the sensor – causing the same particle to be counted multiple times.
It’s always useful to have perspective on the tools used, the method, and the collected data
TO go further
As is often the case, ADEME publishes excellent guides, simple and illustrated, on air quality topics, particularly regarding indoor air.


